![[Benchmark] What 500 Loyalty Programmes Teach Us](https://cdn.prod.website-files.com/61041c17d459ea6dbba7b4c0/67e3fa22aa837d9307e2135c_Loyalty-program-benchmark.webp)
.png)


Customer loyalty has never been more central.
Between the rising Customer Acquisition Cost (CAC), pressure on margins, and the need to extend the post-purchase relationship, brands can no longer rely on simple points accumulation or discount systems.
Today, the real question is no longer “Do you need a loyalty programme?” but rather “Does your loyalty programme truly create an experience for your customers?”
And to find out, you need to compare real data, not intentions.
👉 Check out how to build a top-performing loyalty programme.
This is exactly what this benchmark by Loyoly offers, based on figures observed from over 500 ecommerce companies.
These brands represent every sector of retail: fashion, beauty, food, home, health, family, pet care and more, a sample that truly reflects the diversity of commerce.
The ambition is to provide reliable benchmarks based on concrete indicators, helping you assess and improve your customer loyalty strategies.
Because between a “showcase” programme and one that delivers +60% LTV, there is a world of difference.
👉 Discover our full benchmark with sector-by-sector analysis
What is a Loyalty Programme Benchmark?
A benchmark in e-commerce is an analytical tool.
It is not about copying competitors but about understanding where your brand stands compared to industry standards, using measurable and comparable data.
Applied to customer loyalty, this type of analysis answers a key question: does your system actually create retention or just inertia?
In other words, does it make your customers come back, or do their rewards just gather dust?
A good comparison relies on data, not intuition. It reveals your strengths, blind spots, and the levers you can activate to improve customer satisfaction.
👉 Discover 10 practical actions to retain your customers
The Objectives of This Benchmark
Why compare your loyalty programme?
To know where to focus your efforts and understand what truly works.
A well-designed benchmark allows you to:
- Identify gaps between your programme and retail standards (activation, participation, repeat purchase, profitability)
- Understand real customer behaviour: rewards used, interactions, sign-ups, and activity levels
- Prioritise the levers that maximise Customer Lifetime Value (LTV), Average Order Value (AOV) and purchase frequency
- Demonstrate the programme’s contribution to financial or CRM teams
In short, a benchmark is not just a marketing audit.
It is a mirror of your customer experience, revealing whether your loyalty programme is alive and thriving or just going in circles.
How We Conducted This Benchmark
Every sound analysis begins with reliable data.
This one is based on real results observed directly on the Loyoly platform.
No declarations, no estimates, only behavioural data from real consumers.
Concrete and diversified data
The study includes over 500 brands across multiple sectors: fashion, beauty, food, home, health, family, pet care, and more.
Indicators were grouped by category to create consistent averages, without weighting by company size or sales volume.
The goal is not to crown a “best programme” but to offer a neutral benchmark you can use to progress.
Data was observed over two timeframes:
- 30 days for engagement indicators (activation, usage, referrals)
- 90 days for business indicators (LTV, AOV, order volume, participation)
A contextualised reading
Each industry approaches loyalty differently. Beauty and food rely on recurrence, while home and fashion focus on personalisation and service.
The same indicator can tell a very different story depending on the business type.
The right benchmark is not the average, but the balance point between management cost, customer satisfaction, and repeat purchase.
Benchmark of the 9 Key KPIs to Manage in Your Loyalty Programme
Before diving into the figures, a quick reminder: these nine KPIs are the ones that truly assess the overall performance of a loyalty programme.
They cover the entire customer lifecycle, from initial activation to final profitability, showing how effectively your programme turns customers into loyal and engaged members.
👉 Discover 11 essential KPI to measure and strengthen customer loyalty
1. Activation Rate
The activation rate measures the percentage of customers who joined the loyalty programme out of all eligible buyers, marking the true start of the relationship. Without activation, sustainable loyalty is impossible.
(Number of enrolled customers ÷ Total eligible customers) × 100
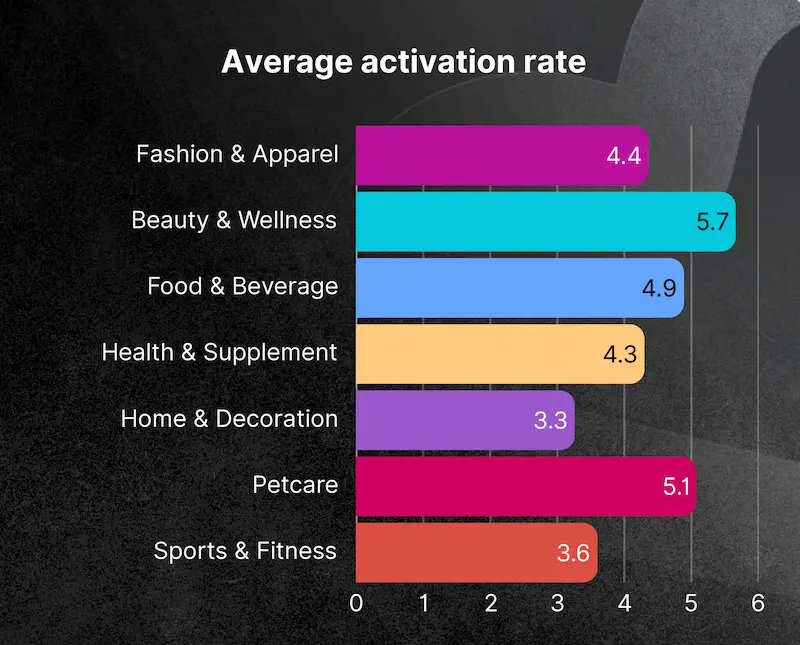
Sectors with high purchase frequency (food, beauty, health) show the best activation rates, as their customers have more opportunities to use rewards.
In longer-cycle sectors like home, the challenge is to stay present between purchases and encourage activation when the time is right.
Levers to activate:
- Offer diverse rewards tailored to multiple profiles (discounts, exclusive access, charity donations)
- Simplify access to the first reward levels to trigger early activation
- Make your programme visible across your ecosystem: homepage, account, post-purchase emails, social media, checkout
2. Participation Rate
This KPI measures the percentage of members who have completed at least one action during the period (purchase, review, share, etc.). It helps evaluate their real level of engagement within the loyalty programme.
(Active members ÷ Enrolled members) × 100
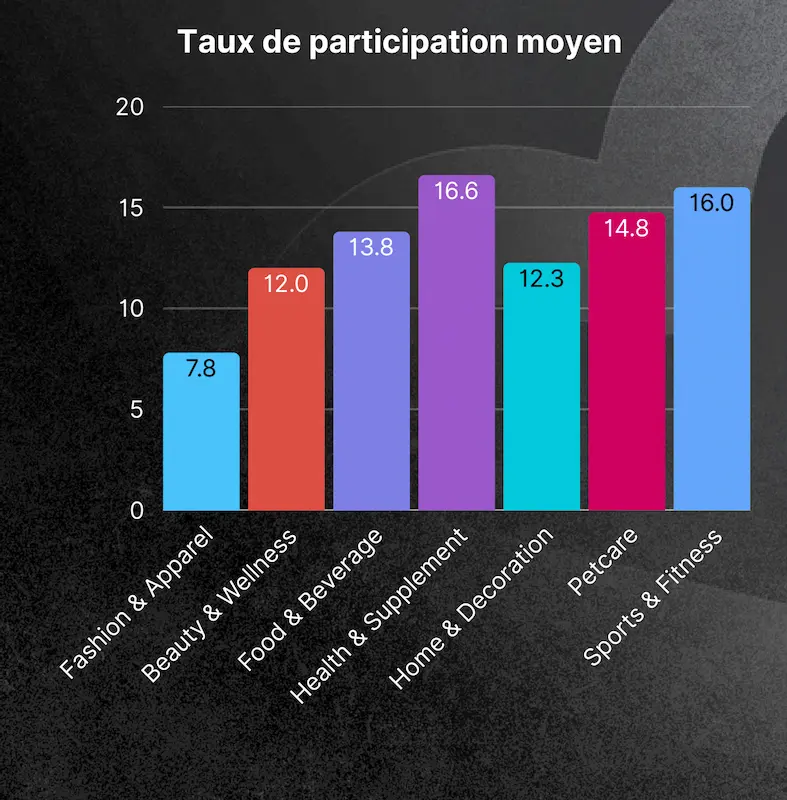
Sectors with high purchase frequency and a strong community dimension display the highest engagement rates. These brands have turned their programmes into spaces for interaction where customers feel valued.
Conversely, more transactional or aesthetic industries often struggle to stimulate participation, usually because their mechanics lack perceived relevance or reward. The more aligned the actions are with the brand identity, and the more recognition they provide, the higher the participation climbs.
Levers to activate:
- Diversify engagement mechanics: opt-ins, reviews, UGC, social interactions, surveys
- Regularly animate the programme around key moments such as new launches, seasonal campaigns, or special events
- Make engagement opportunities visible and accessible throughout the customer journey: in emails, the loyalty account, or mobile apps
- Gamify the experience with symbolic rewards or temporary bonuses to sustain participation over time
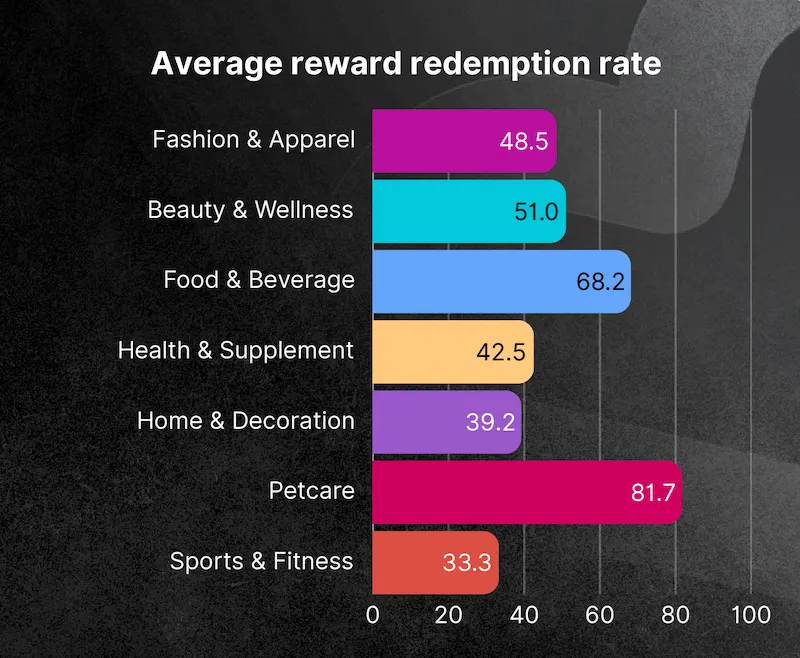
3. Points Redemption Rate
This KPI measures the percentage of members who have redeemed their points to obtain rewards such as discounts, gifts, or exclusive experiences. It reflects the perceived value of the programme and the attractiveness of its rewards.
(Points redeemed ÷ Points earned) × 100

When points accumulate without being used, the programme’s dynamic weakens and its perceived value declines. Top-performing brands make their rewards accessible quickly and keep them visible throughout the customer journey.
By contrast, rewards with thresholds that are too high or poorly communicated can limit engagement and reduce repeat purchases.
Levers to activate:
- Make the first rewards achievable after the first few purchases to create a habit of redemption
- Send automated reminders via email, SMS or WhatsApp showing the points balance to maintain attention
- Create a controlled sense of urgency with limited-time bonuses to encourage redemption
4. Reward Usage Rate
This KPI measures the percentage of members who have actually used a reward (offer, service, or gift) obtained through the programme. It indicates how smoothly the reward experience works and how appealing the benefits are.
(Rewards used ÷ Rewards earned) × 100
When customers claim rewards but do not use them, it often signals a breakdown in the loyalty journey, such as lack of reminders, technical friction, or low perceived value.
On the other hand, when rewards are simple to redeem and highlighted at the right time in the customer journey, usage rates rise sharply. Each redeemed reward should translate into a tangible and immediate experience that fuels satisfaction and loyalty.
Levers to activate:
- Automate multi-channel reminders (email, SMS, WhatsApp, push notifications) encouraging members to use rewards before expiry
- Simplify redemption conditions: fewer restrictions mean more activation
- Position rewards strategically during key moments of the purchase journey such as in emails, on the account page, or at checkout
5. Referral Conversion Rate
This KPI measures the percentage of referred people who actually make a purchase. It evaluates how effectively the referral programme converts recommendations into real sales.
(Number of referred buyers ÷ Number of referred leads) × 100
👉 Check out our complete referral programme guide
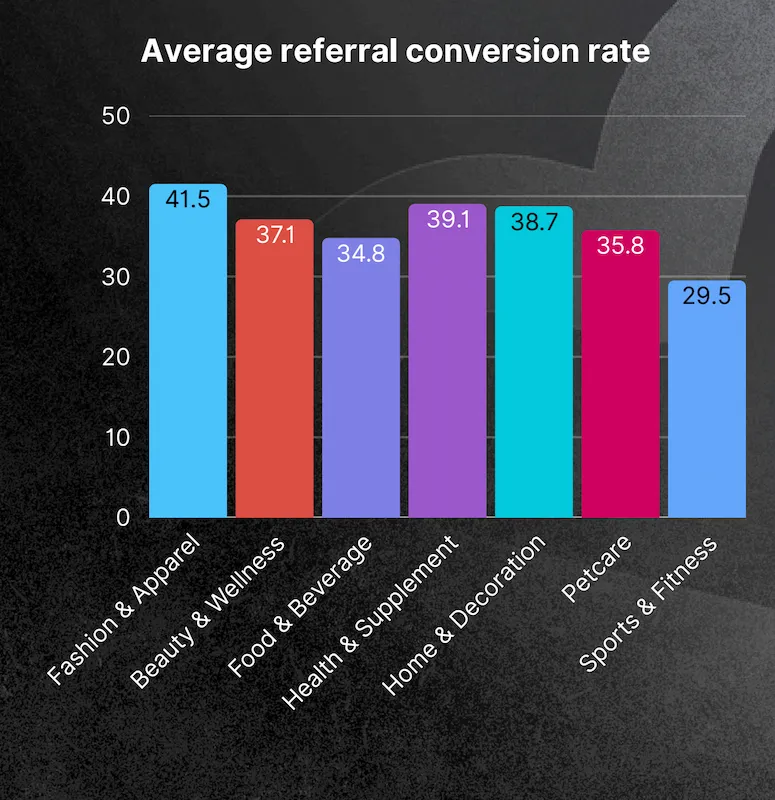
Conversion rates typically range from 30% to 40%, showing the power of customer advocacy. The best results are seen in sectors where trust and product proof matter most, such as fashion, beauty, or health.
Conversion increases when the offer is immediate, easy to understand, and balanced between referrer and referee, ensuring both perceive clear and rapid value.
Levers to activate:
- Optimise the referral journey to be smooth, mobile-first, and frictionless
- Integrate referral prompts into CRM scenarios such as post-purchase emails, customer accounts, or thank-you pages
- Re-engage inactive referees with automated sequences before their codes expire to maximise conversion
- Test different incentives (vouchers, discounts, loyalty points) to identify which performs best based on your AOV
6. Share of New Customers from Referrals
This KPI measures the proportion of new buyers acquired through the referral programme, compared to the total number of new customers over a given period. It shows how much your programme contributes to organic growth.
(New customers via referrals ÷ Total new customers) × 100
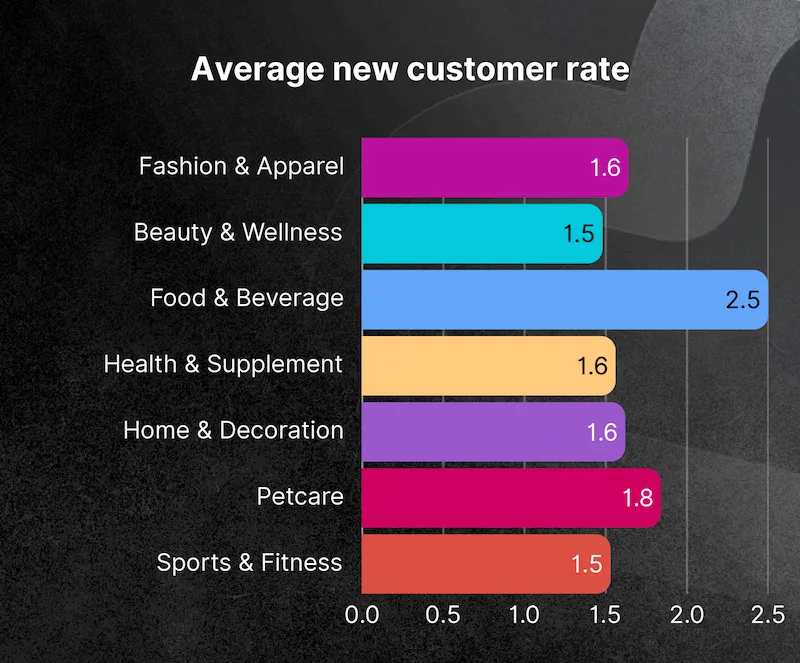
Sectors with high purchase frequency tend to achieve the best results, as trust and purchase repetition make referral easier. In more aspirational sectors like fashion, beauty, or home décor, referrals often strengthen brand awareness and social credibility.
Performance depends as much on the structure of the offer as on the community’s engagement. The more engaged your customers are, the stronger your word-of-mouth acquisition becomes.
Levers to activate:
- Personalise referral messages with an authentic tone from the referrer, rather than generic promotional copy
- Make sharing effortless with copy-paste links, emails or SMS options
- Keep the momentum with double bonus campaigns, community challenges, or seasonal activations
7. Impact of Engagement Mechanics
This analysis measures how engagement mechanics (reviews, UGC, opt-ins, social interactions) influence three key indicators: average number of orders, Average Order Value (AOV), and Lifetime Value (LTV).
The goal is to quantify the business impact of customer engagement across the post-purchase journey.

The figures are clear: the more customers interact, the higher their LTV. In fashion, LTV increases by more than 60% between low-engagement and highly engaged customers. In beauty, purchase frequency doubles after three completed engagement actions.
Recurring industries such as supplements or pet food confirm this trend: relational engagement directly fuels commercial performance.
By multiplying emotional and experiential touchpoints, brands extend the relationship beyond transactions and turn customers into true brand advocates.
8. Overall Programme Impact
After measuring engagement mechanics, this analysis widens the focus to assess the overall impact of the loyalty programme on purchasing behaviour. It compares engaged customer cohorts* with non-engaged customers to evaluate the real effect on profitability and LTV.
*Engaged customers are those who have made at least one purchase containing a reward earned through the programme.
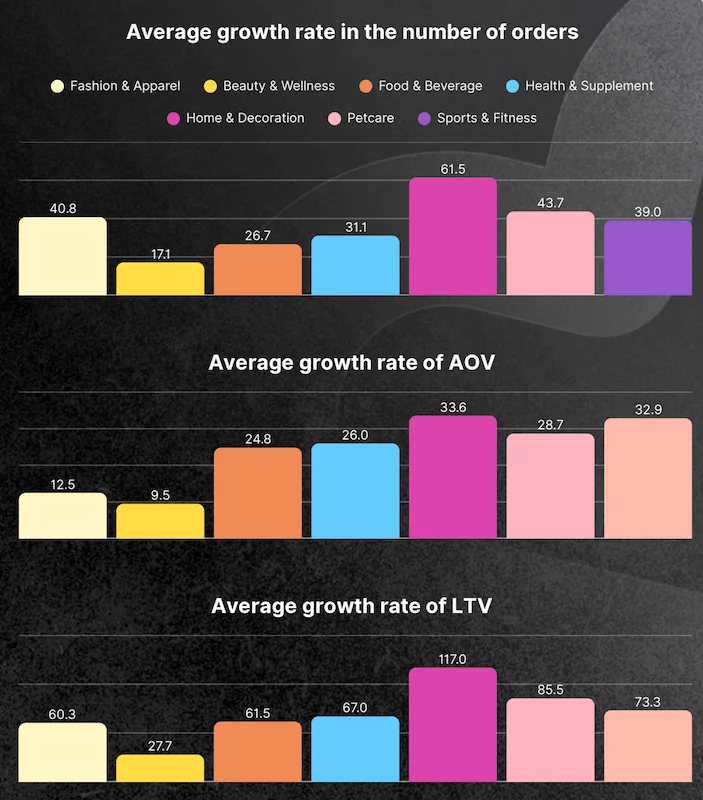
The gaps between cohorts are striking. Programme activation significantly enhances performance.
In Home and Décor, LTV rises by +117%, driven by a +61% increase in order volume.
Food, supplements, and pet care record +60% to +85% growth in LTV.
Even in more volatile sectors like fashion or beauty, engaged customers achieve +40% to +60% higher LTV.
A well-integrated loyalty programme does not simply drive repeat purchases; it makes customers structurally more profitable. Each additional point of programme penetration contributes directly to revenue growth and improves the overall ROI.
9. Return on Investment (ROI)
The ROI of a loyalty programme indicates how much value is generated for every pound invested. It helps assess the profitability and efficiency of the programme’s resources.
ROI = (Value generated by the programme ÷ Amount invested)
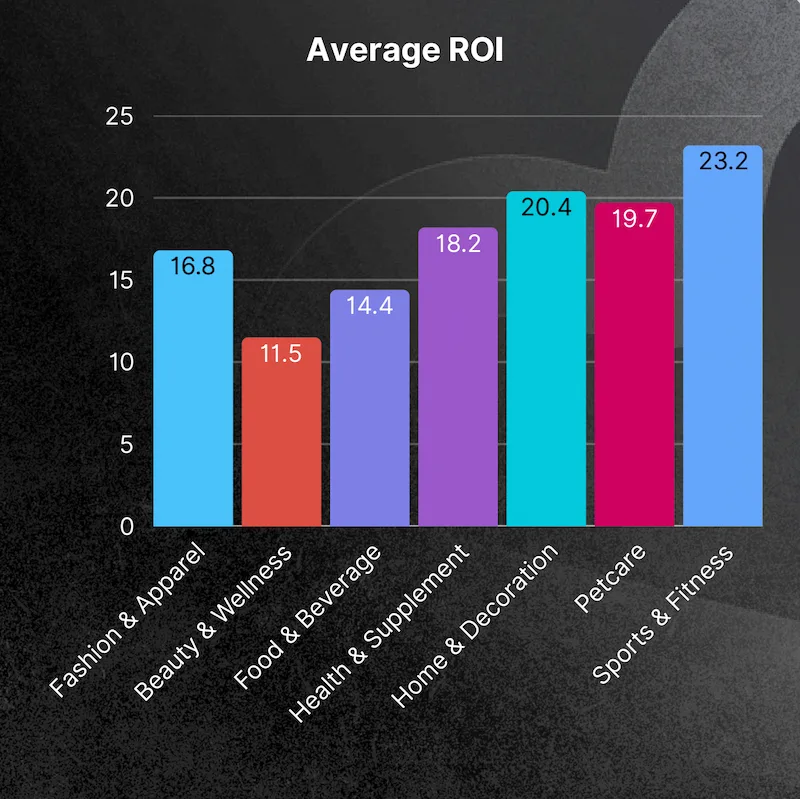
The highest ROI is found in sectors with strong purchase recurrence and stable AOV, such as sports and pet products. These brands capitalise on a loyal customer base and consistent activation patterns, where every interaction feeds profitability.
Lower ROI does not necessarily indicate poor performance; it can reflect newer programmes still gaining momentum or those offering higher-cost rewards.
Levers to activate:
- Optimise the reward-to-margin ratio by favouring high perceived value but low operational cost benefits (for example, exclusive access or dedicated customer service)
- Segment promotional efforts, focusing incentives on high-potential groups (top spenders, VIPs, dormant customers to reactivate)
- Use data-driven insights to pilot campaigns, triggering targeted and profitable re-engagements when points are unused, rewards are unclaimed, or thresholds nearly reached
Pssst... You might find this interesting!
Explore the complete benchmark and compare your programme with others in your sector.
What to Take Away from This Benchmark
This benchmark highlights one simple truth: loyalty is no longer a mechanism, it is an experience.
The brands that stand out are those that make their programmes visible, seamless and alive.
When the promise is clear, participation follows.
When interactions are varied, relationships deepen.
And when loyalty is managed as a long-term investment, it becomes a true growth driver.
In short: less marketing talk, more meaningful and measurable connection.
.webp)