
.png)


You know what your ads cost. You probably know your revenue. What most brands cannot answer precisely is what a single new customer actually costs them, and that gap is where margin quietly disappears.
CAC (customer acquisition cost) is the metric that closes it. It turns a marketing budget into a number you can compare, defend and act on, whatever your sector.
What is customer acquisition cost (CAC)?
Customer acquisition cost represents what a business invests to turn a prospect into a first purchase. It covers everything spent on sales and marketing over a given timeframe, divided by the new customers those efforts produced.
Unlike indicators such as LTV or ROI, CAC focuses exclusively on what it takes to acquire new customers. It says nothing about what happens after the first purchase, which is both its strength and its limit: it isolates one question and answers it cleanly.
The metric applies to any model. An ecommerce brand, a retailer and a SaaS company all use the same formula, even though what counts as an acquisition-related expense differs between them. A subscription business will include onboarding costs that a marketplace never incurs.
One clarification before going further. People use CAC and cost per acquisition interchangeably, and they are not the same. Cost per acquisition measures the cost of any conversion, including a newsletter signup or a demo request. CAC measures only the acquisition of an actual customer.
Why is customer acquisition cost (CAC) so important?
A well-managed customer acquisition cost reflects an efficient marketing strategy. Left unmeasured, it is the fastest way to grow revenue while losing money on every order.
Optimizing return on investment (ROI)
CAC sits in the denominator of almost every profitability question you will ask. Without it, you can see which campaigns produce volume but not which ones produce profit.
Take a company with a CAC of €200 and an LTV of €800. That business generates a positive return on investment on every customer it acquires, and it can afford to increase its budget to grow faster. Reverse those two figures and the same growth destroys the company.
This is also what separates a marketing investment from a marketing expense. When you can prove that each euro put into acquisition comes back multiplied, the figure will help you win budget conversations instead of arguing them.
Improving profitability and profit margins
Every euro saved on acquiring a new customer falls straight to the bottom line. Reducing CAC by 20% has the same effect on profitability as raising prices by a comparable amount, without the risk of losing customers.
It is also a financial reality check. A product with a healthy gross margin and a CAC nobody tracked can be losing money on every single sale.
Profitability improves faster through CAC than through almost any other lever, because the saving is immediate. A pricing change takes months to work through your order book; a channel reallocation shows up in the next reporting month.
Informing strategic decision-making
CAC is a key metric well beyond marketing. It drives which channels to fund, which segments to target, which markets to enter, and how much cash a growth plan actually needs.
It should also determine what you can afford. A business that knows its true CAC by channel can shift resources with confidence. One that does not is guessing with real money, and usually discovers the problem when the bank balance says so.
The same information shapes hiring, forecasting and cash management. If you know it costs €200 to bring in someone new and you need 1,000 of them next year, your acquisition budget is no longer a negotiation. It is arithmetic.
Enhancing marketing and sales efficiency
Tracking CAC by channel and by campaign exposes performance gaps that aggregate reporting hides. A channel delivering plenty of leads at three times your average cost looks successful until someone calculates it properly.
The same applies to your sales team. Time spent on prospects who rarely convert is an acquisition expense like any other, and measuring it changes how that time gets allocated.
Channel performance is rarely uniform. Most companies find that two or three channels carry the business while the rest quietly consume budget, and only a per-channel calculation makes that visible.
%20so%20important.png)
How to calculate customer acquisition cost (CAC): a step-by-step guide
The calculation takes three steps. The arithmetic is trivial; the judgment is in deciding what to include.
Step 1: Sum up all marketing and sales expenses
Total the sales and marketing expenses incurred over your chosen period: media budget, agency retainers, professional services fees, software subscriptions, content production, salaries and commissions for the people doing the work.
Pick a timeframe that matches your buying cycle. A month works for fast-moving ecommerce; a quarter is more honest for considered purchases, where the money goes out and the customers arrive in different weeks.
Step 2: Determine the number of new customers acquired
Count only genuinely new customers. Repeat purchases, upgrades and reactivated accounts do not belong here, and including them will understate your CAC.
This is where most calculations get sloppy. If your analytics treat a returning buyer as new because they used a different email address, your figure will look better than it is. Deduplicate before you divide.
Step 3: Divide total expenses by the number of new customers
Divide the total from step one by the total number from step two. That figure is what it costs you, on average, to acquire a new customer.
An example in figures. A company invests €10,000 in marketing over a month, covering paid search, influencer partnerships and in-house payroll, and acquires 50 new customers. The CAC is €10,000 ÷ 50 = €200 per customer.
The core CAC formula
CAC = total sales and marketing expenses ÷ number of new customers acquired
Simple to state, easy to get wrong. The CAC formula itself is never the problem: what you put into it is. Two companies in the same industry can report acquisition costs that differ by half purely because of what each one chose to count.
.png)
What to include in your CAC calculation
Three categories of sales and marketing cost belong in the numerator. Leave any of them out and your figure will flatter you.
Marketing expenses (e.g., advertising, content creation, SEO)
Everything spent to attract prospects: advertising in all its forms, content production, SEO work whether internal or outsourced, social media, events, and the software you pay for every month.
Include agency retainers and freelance fees. They belong here even when finance books them under a different line, and excluding them is the single most common reason a reported CAC turns out to be fiction.
Sales expenses (e.g., salaries, commissions, tools)
Pay and commissions for anyone whose job is converting prospects, plus the tools they use. CRM licenses, sales enablement software, prospecting databases, and the cost of demos, trials or samples given to prospects.
For an ecommerce business with no sales team, this category shrinks to your support cost during the pre-purchase phase, which is easy to forget entirely. Someone answering sizing questions on live chat is doing sales work.
Overhead costs related to acquisition
The indirect costs everyone omits: training, onboarding new hires, acquisition-related infrastructure, creative production, professional services and the analytics stack required to measure it all.
These rarely change your CAC dramatically, but they are the difference between a figure you can defend to finance and one you cannot. A useful test: if the cost would disappear the day you stopped having to acquire customers, it belongs in the calculation.
New CAC vs. Blended CAC: understanding the difference
These two metrics answer different questions. Understand which one you are looking at before you draw any conclusion from it.
Blended CAC divides your total sales and marketing spend by all new customers acquired, including those who came organically. It is easy to calculate and useful as a headline health check, but it flatters your paid channels by crediting them with customers who would have found you anyway.
New CAC, often called paid CAC, divides the money you actually put into acquisition by the customers it produced. It is harder to attribute correctly, and it is the figure you need when deciding whether to increase a line item.
Track both. Blended CAC tells you where the business stands overall; new CAC tells you whether the next euro will pay for itself. A widening gap between the two is good news, because it means organic, referral and word-of-mouth channels are carrying more of the load.
The gap also gives you a clear read on dependency. A brand whose two figures sit close together has built its growth entirely on rented audiences, and that is a fragile position the day auction prices move.
What is a good customer acquisition cost?
There is no universal answer, and any number quoted without context is meaningless. A good CAC is one your lifetime value comfortably supports.
Industry benchmarks vary enormously. For example, a consumer goods brand with a €40 average order value and a €200 acquisition cost is in serious trouble. A B2B software company with the same figure and a €5,000 annual contract is doing perfectly well.
Rather than chasing an absolute target, determine whether your CAC works by judging it against three things: your own trend over time, your LTV/CAC ratio, and your payback period. Those three tell you everything the raw figure cannot.
There is more to learn from the direction of travel than from the figure itself. A rising CAC is normal as you exhaust your cheapest audiences, and it only becomes a problem when it climbs faster than the margin behind each order.
The crucial relationship between CAC and Customer Lifetime Value (LTV)
CAC on its own is half a sentence. Paired with lifetime value, it becomes the most important relationship in your unit economics.
Understanding Customer Lifetime Value (LTV)
Customer lifetime value is the total gross margin a customer will generate across the whole relationship, not just the first order. It accounts for repeat purchases, basket size and how long the relationship lasts.
The difference between the two metrics matters. CAC is settled once, up front. The margin comes back over months or years, which is why a high acquisition cost can be perfectly rational when retention is strong, and ruinous when it is not.
Doing that calculation properly is its own exercise, and the honest version uses gross margin rather than revenue. Counting turnover instead of margin is how businesses convince themselves an unprofitable channel is working.
Optimizing the LTV/CAC ratio for sustainable growth
The ratio is the key number to steer by. The widely used reference is 3:1: each customer should bring back at least three times what they cost to acquire.
Below a 3:1 ratio, growth is expensive and fragile. Above 5:1, you are probably under-investing and leaving growth on the table, because you could acquire new customers profitably at a higher price than you currently pay.
Take the earlier example. A CAC of €200 against an LTV of €800 gives a 4:1 ratio, which reflects an effective model with room to increase spending. When CAC matches or exceeds LTV, every new customer makes the business poorer.
This is also why retention work reduces acquisition pressure. Raising retention improves the ratio without touching your marketing budget at all: the Loyoly Loyalty Benchmark 2026 measures 175.4% more gross margin over the relationship among loyalty program members than a comparable group who never enrolled.
Effective strategies to reduce customer acquisition cost (CAC)
Customer acquisition rarely gets cheaper on its own. The eight levers below are ordered roughly by how fast they lower your CAC, and most of the work is budget management rather than clever tactics. The best results come from taking them in order rather than trying all eight at once.
1. Optimize your sales and marketing funnel
Every prospect lost between first visit and purchase raises the cost of the ones who make it through. Fixing a leak in the funnel is almost always cheaper than buying more traffic to compensate for it.
Map the drop-off points and address the largest first. A checkout that loses 70% of carts is a bigger acquisition problem than any campaign can solve, and the fix usually costs a developer a week.
2. Strengthen the effectiveness of sales and marketing spend
Calculate CAC by channel rather than in aggregate, then shift resources from the expensive channels to the efficient ones. This sounds obvious and remains the most neglected optimization available to most teams.
Do not concentrate everything in one place, though. Multiplying touchpoints increases your chances of reaching your audience, and a single-channel acquisition strategy becomes a liability the day that channel changes its pricing.
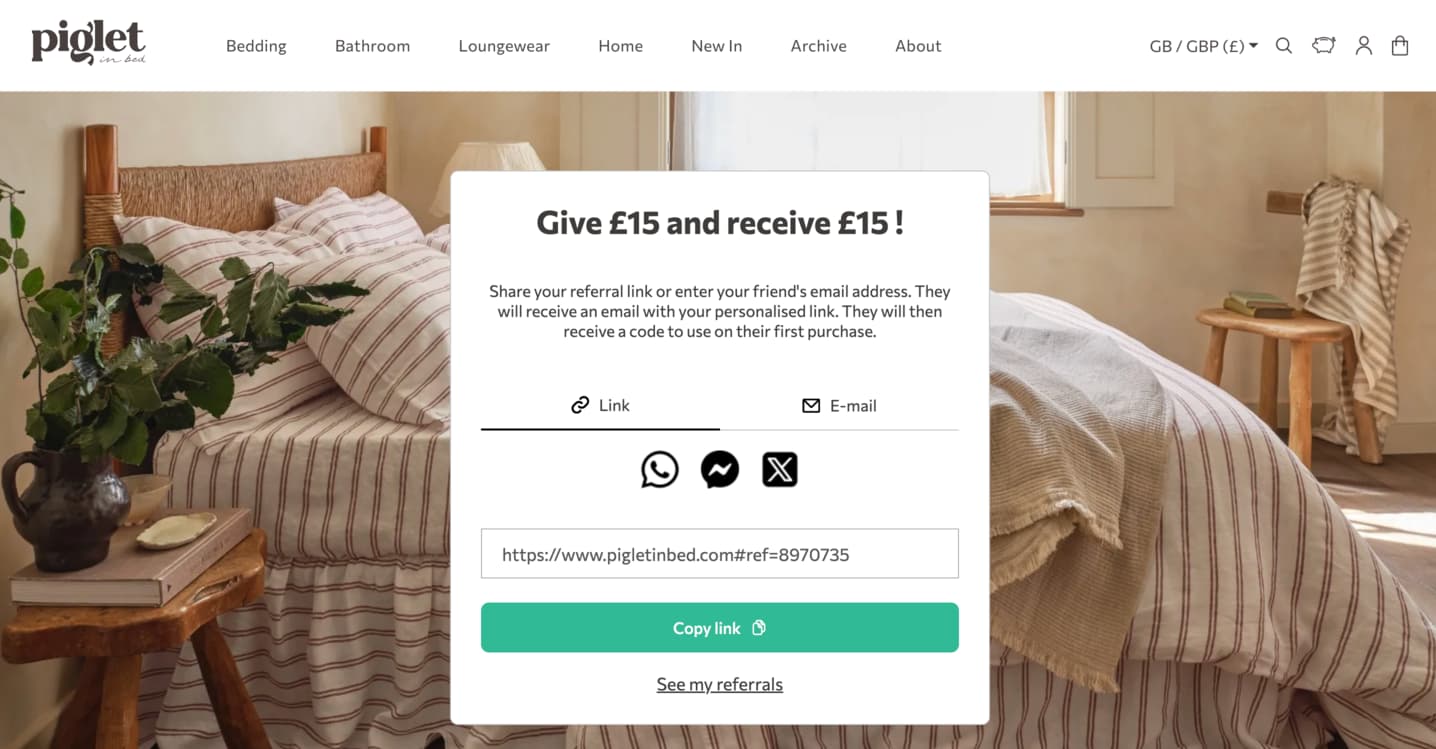
3. Leverage referral programs and word-of-mouth marketing
This is the most direct lever available, because you only pay after a sale rather than per click. It also gives you access to networks you cannot buy.
The conversion gap makes the case. Across the 600+ ecommerce brands in the Loyoly benchmark, 37.1% of invited contacts make a first purchase, a rate no other channel comes close to matching. Referred customers arrive pre-qualified by someone they trust, which shortens the decision and improves retention afterwards.
The headroom is substantial. Referrals account for only 1.5% of new customers on average, and 47% of consumers say they rarely or never share a referral code. That is a visibility problem, not a demand problem, and it is usually solved by asking at the right moment.
4. Enhance customer retention and loyalty
Retention lowers CAC in two ways. You need fewer new customers to hit the same revenue, and loyal customers create referrals that cost a reward rather than an auction bid.
The Loyoly Industry Report 2025, based on 1,016 consumers, found that 59% of loyal customers are willing to recommend a brand. That willingness already exists in your base; a loyalty program simply gives it somewhere to go.
5. Improve conversion rates across touchpoints
A conversion rate improvement lowers customer acquisition cost mechanically. Improve it across the funnel and the same budget produces more customers, with no additional traffic to pay for.
Work on the pages carrying the most traffic first: product pages, checkout, and the landing pages behind your campaigns. Social proof will help here more than copywriting does, which is why reviews and customer photos belong on the page.
6. Optimize your pricing strategy
Pricing changes what you can afford to invest in acquisition. A higher average basket or a subscription model raises LTV, which in turn justifies a higher CAC at the same ratio.
Bundles, free delivery thresholds and tiered offers all lift order size without requiring more traffic, which improves your unit economics from the other end. Improve what each buyer is worth and you rarely need to make acquisition cheaper at all.
7. Conduct effective market research and targeting
Acquiring the wrong customers is expensive twice: once in acquisition budget, and again in the churn that follows. Sharper targeting reduces both.
Use your own data rather than generic personas. Analyzing which existing segments deliver the best returns tells you exactly who to target, and Loyoly publishes a guide to RFM segmentation in its resources if you want a practical scoring method.
8. Implement inbound marketing strategies
Content that answers real questions attracts qualified traffic without paying per visitor. Articles, guides and videos addressing prospect needs create leads for years after publication.
Evergreen content compounds in a way a campaign never does. A tutorial or case study written once keeps producing customers long after the budget is gone, which steadily lowers your blended CAC. Of course it takes longer to pay off, and that is exactly why most companies underinvest in it.
.png)
Success story: how Hindbag reduced its CAC with referral
Hindbag, a brand producing eco-responsible bags, wanted to increase sales while reducing its customer acquisition cost. Working with Loyoly, the brand built a referral program based on social proof and customer recommendations.
The results:
- x2.5 LTV on the cohort involved in the program
- +140k generated through the viral effect of referral
- 3% of customers acquired through referral
- +7,000 opt-ins collected by email and SMS
- +3,000 customer reviews gathered
- +300 pieces of UGC, with image rights included
The acquisition cost fell because each recommendation brings in a buyer at the price of a reward rather than a click. Those opt-ins carry genuine financial worth too: they turn a one-off campaign into an owned audience the brand can reach again for free, and that data keeps producing sales long after the program pays for itself.
How to analyze your customer acquisition cost
A figure produced once a year and filed away is worth very little. What counts is analyzing it in context and acting on what it shows.
Segment before you conclude. Analyze the metric by channel, by campaign, by product line and by customer segment. Blended performance hides the extremes: one channel performing brilliantly, another quietly burning money.
Track the trend, not the snapshot. One month tells you nothing. Twelve months of the same calculation tells you whether your customer acquisition is getting more or less efficient as you scale, and that trend is what you learn from.
Compare against the payback window. How many months of margin does it take to earn back what you invested acquiring a new customer? That question is often more useful than the ratio itself, because it tells you how much working capital is required.
Watch three common mistakes. Forgetting indirect costs such as training and infrastructure. Confusing blended CAC with per-channel CAC, when each channel behaves differently. And attributing costs to the wrong lever, which makes the whole analysis unreliable no matter how carefully everything else was calculated.
Then act on what you learn. The point of measuring CAC is not to have the number in a dashboard; it is to change where the money goes next quarter.
Customer acquisition cost (CAC) FAQs
How do I calculate CAC by channel?
Attribute both budget and acquired customers to each channel separately, then divide as usual. The cost side is straightforward; the customer side requires attribution data you trust.
Pick an attribution model first and apply it consistently: last click, first click or multi-touch. Switching between models across reporting periods makes comparison impossible, and comparison over time is where the useful information lives.
How long should the CAC payback period be?
The common reference is twelve months or less, meaning a year of gross margin covers what you invested acquiring the customer.
What is acceptable depends on your financial position more than on any benchmark. A well-funded company can tolerate an eighteen-month payback; a business financing growth from its own cash flow usually cannot, and pushing it will end badly.
What are the preferred communication channels of modern customers?
Email leads by a wide margin. The Industry Report 2025 found 76% of consumers prefer email for brand communication, ahead of SMS and WhatsApp at 52%, postal mail at 23% and social media at 16%.
The direction of the conversation changes the answer, though. People are noticeably more open to messaging apps and phone calls when they initiate contact themselves, which should help you design a support flow rather than a campaign.
How to track and optimize CAC in SaaS businesses
SaaS businesses face a specific complication: revenue arrives monthly while the cost lands up front, so a healthy company can look unprofitable for months on end. Understand that lag or you will kill a channel that was working.
Track CAC alongside payback and net revenue retention rather than on its own. And separate acquisition from expansion, because landing a new account and growing an existing one have entirely different economics that averaging together will hide.



.webp)